Central
Indiana homes sold more quickly in March,
housing
inventory increases compared to this time last year
INDIANAPOLIS
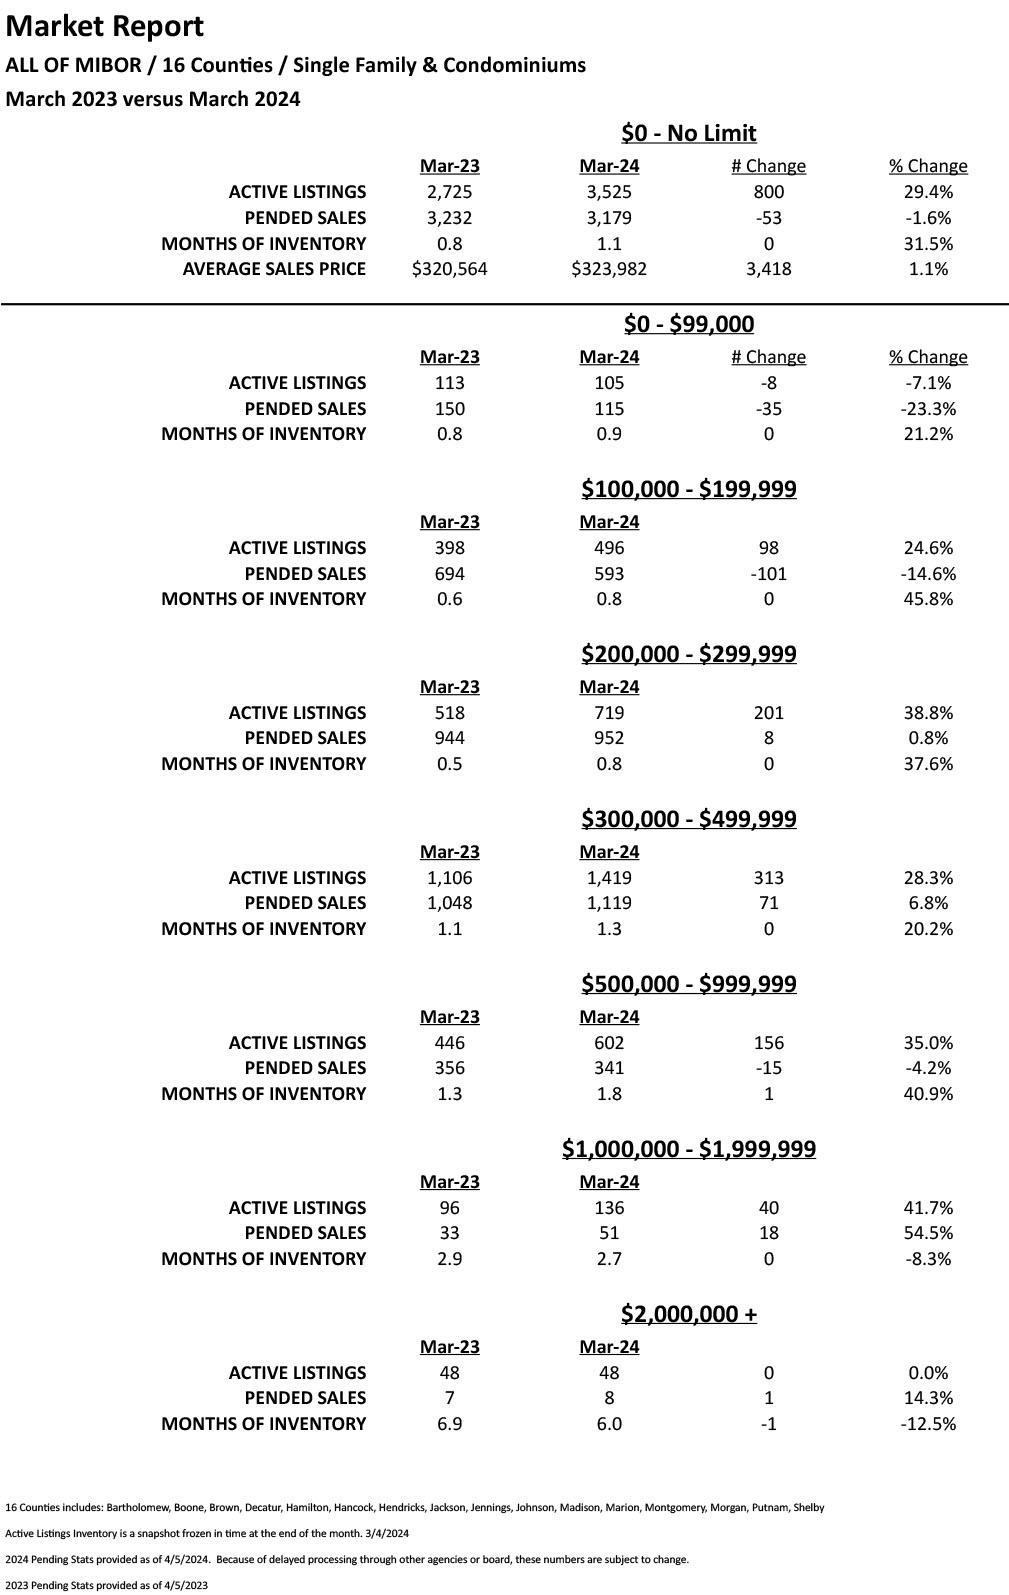
(April 11, 2024) March 2024 saw a continued increase in available housing
inventory and homes selling more quickly than this time last year. According to
F.C. Tucker Company, part of the Howard Hanna family of companies:
● Available
housing inventory increased 29.4 percent compared to March 2023.
● Homes
sold 10 days, or 18.5 percent, faster than this time last year.
● Compared
to March 2023, the average home sale price for the 16-county central Indiana
region increased 1.1 percent to $323,982.
● Pended
home sales decreased slightly, down 1.6 percent compared to this time last
year.
In March 2024, 3,179 central Indiana homes
were purchased, down 1.6 percent from the 3,232 sold in March 2023.
● Decatur County had the greatest increase in pended home sales in March 2024, up 135.3 percent compared to this time last year.
●
Boone
County pended sales had the greatest decrease, with 18.2 percent fewer homes
sold compared to March 2023.
Central Indiana
year-to-date home sale prices increased, up 3.5 percent overall:
● Morgan County recorded the highest average year-to-date home sale price increase at 16.5 percent.
● Hamilton County had the highest average year-to-date home sale price in the region at $487,862.
● Homes sold in 44 days on average, selling 10 days, or 18.5 percent, faster than March 2023. Brown County homes sold 40 percent faster than this time last year, the greatest increase in central Indiana. All but one central Indiana county, Boone County, saw homes leaving the market more quickly compared to this time last year.
Central Indiana experienced a 29.4 percent
increase in overall available home inventory in March 2024, compared to March
2023, with 800 more homes available for sale.
● Jennings County had the largest inventory increase – up 244.4 percent compared to March 2023.
● Boone County experienced the largest decrease in inventory – down 22.8 percent compared to this time last year. In the 16-county central Indiana area, Boone County was the only county with a decrease in inventory.
“The residential real
estate market continues to strengthen as we move into the second quarter of
2024. Inventory continues to increase across central Indiana, which offers
prospective buyers a wide selection of homes from which to choose. We are also
seeing homes leave the market more quickly compared to last year, which is what
we would anticipate seeing this time of year,” said Jim Litten,
president of F.C. Tucker Company.
Of the pended home sales in the region last month, eight were priced
$2,000,000 or higher; 51 were priced $1,000,000 to $1,999,999; 341 were priced
$500,000 to $999,999; 1,119 were priced $300,000 to $499,999; 952 were priced
$200,000 to $299,999; 593 were priced $100,000 to $199,999; and 115 were priced
at $99,999 or less.
Editor’s Notes:
● All statistics were compiled by F.C. Tucker
Company from a report drawn from BLC® statistics on April 5, 2024. Because of delayed processing
through other agencies or boards, these numbers are subject to change.
● Effective April 7, 2019, data from MIBOR only
reports on single family homes and excludes condo sales. F.C. Tucker will
continue to include condo sales in this report.
● “Pending” means the sales contract has been
signed, but the transaction has not closed. According to the NAR, pending sales
typically are finalized within a month or two of signing.
● “Active
Listings – Inventory” is a snapshot frozen in time at the end of the stated
month. Per MIBOR, effective April 1, 2018, “Active with Contingency” no longer
is a status in the BLC® listing service in order to present a true picture in
advertising and marketing. Those listings that were in the "Active with
Contingency" status have been moved from the "Active" status to
the "Pending" status.
●
For
this report, F.C. Tucker tracks the following counties: Bartholomew, Boone,
Brown, Decatur, Hamilton, Hancock, Hendricks, Jackson, Jennings, Johnson,
Madison, Marion, Montgomery, Morgan, Putnam and Shelby. The first report
tracking Jackson County data was pulled August 7, 2019.
PENDED
SINGLE-FAMILY AND CONDOMINIUM SALES
|
County |
March 2023 |
March 2024 |
Month-to-month
% Change |
Year-to-date
|
|
Bartholomew |
102 |
92 |
-9.8% |
2.1% |
|
Boone |
132 |
108 |
-18.2% |
-0.7% |
|
Brown |
20 |
26 |
30.0% |
-1.7% |
|
Decatur |
17 |
40 |
135.3% |
67.3% |
|
Hamilton |
558 |
528 |
-5.4% |
-6.9% |
|
Hancock |
139 |
142 |
2.2% |
-10.1% |
|
Hendricks |
221 |
251 |
13.6% |
16.3% |
|
Jackson |
35 |
37 |
5.7% |
-14.4% |
|
Jennings |
17 |
23 |
35.3% |
12.8% |
|
Johnson |
254 |
241 |
-5.1% |
1.3% |
|
Madison |
194 |
165 |
-14.9% |
-13.6% |
|
Marion |
1,293 |
1,300 |
0.5% |
-1.0% |
|
Montgomery |
61 |
53 |
-13.1% |
4.5% |
|
Morgan |
95 |
82 |
-13.7% |
-11.8% |
|
Putnam |
45 |
50 |
11.1% |
9.1% |
|
Shelby |
49 |
41 |
-16.3% |
-5.0% |
|
TOTAL |
3,232 |
3,179 |
-1.6% |
-1.6% |
ACTIVE LISTINGS – INVENTORY
|
County |
March 2023 |
March 2024 |
% Change |
|
Bartholomew |
88 |
96 |
9.1% |
|
Boone |
136 |
105 |
-22.8% |
|
Brown |
43 |
50 |
16.3% |
|
Decatur |
25 |
34 |
36.0% |
|
Hamilton |
359 |
504 |
40.4% |
|
Hancock |
141 |
162 |
14.9% |
|
Hendricks |
170 |
284 |
67.1% |
|
Jackson |
29 |
47 |
62.1% |
|
Jennings |
9 |
31 |
244.4% |
|
Johnson |
214 |
224 |
4.7% |
|
Madison |
146 |
205 |
40.4% |
|
Marion |
1,131 |
1,492 |
31.9% |
|
Montgomery |
42 |
44 |
4.8% |
|
Morgan |
87 |
111 |
27.6% |
|
Putnam |
53 |
68 |
28.3% |
|
Shelby |
52 |
68 |
30.8% |
|
TOTAL |
2,725 |
3,525 |
29.4% |
AVERAGE SALE PRICE
|
County |
YTD |
YTD |
% Change |
|
Bartholomew |
$275,918 |
$285,291 |
3.4% |
|
Boone |
$419,267 |
$456,544 |
8.9% |
|
Brown |
$423,321 |
$438,153 |
3.5% |
|
Decatur |
$210,029 |
$211,536 |
0.7% |
|
Hamilton |
$478,539 |
$487,862 |
1.9% |
|
Hancock |
$326,741 |
$326,531 |
-0.1% |
|
Hendricks |
$336,286 |
$354,524 |
5.4% |
|
Jackson |
$213,669 |
$214,215 |
0.3% |
|
Jennings |
$187,820 |
$189,371 |
0.8% |
|
Johnson |
$315,431 |
$359,142 |
13.9% |
|
Madison |
$191,067 |
$200,199 |
4.8% |
|
Marion |
$256,106 |
$262,922 |
2.7% |
|
Montgomery |
$188,938 |
$219,876 |
16.4% |
|
Morgan |
$270,007 |
$314,447 |
16.5% |
|
Putnam |
$236,472 |
$261,875 |
10.7% |
|
Shelby |
$229,812 |
$265,378 |
15.5% |
|
TOTAL |
$313,160 |
$323,982 |
3.5% |
# # #
Founded in 1918, F.C. Tucker Company is
Indiana’s largest independently owned comprehensive real estate firm with more
than $5 billion in annual sales, more than 40 offices, and more than 1,500
sales associates throughout Indiana and select markets in Kentucky. F.C.
Tucker’s family of businesses includes a full range of real estate
services—mortgages, title insurance, relocation services, a full line of
insurance products, auctioning and homeowner warranty products. We have earned
a reputation for our exceptional service, experienced sales associates and
“Golden Rule” commitment to clients and employees. In 2021, F.C. Tucker formed
a partnership with Pittsburgh-based Howard Hanna Real Estate Services, the
nation’s largest independently owned real estate brokerage firm, furthering
each company’s ability to provide best-in-class service and enhance the real
estate experience for clients by providing best-in-class agents, products and
services. For more information, visit talktotucker.com.